In order to obtain gm value of a mos for hand calculations of capacitance etc,
1) Perform dc analysis ( simple dc analysis).
2) Use " direct plot " if the conventional method of dc analysis takes too much time (as it did in my case).
3) Analog simulation envt->results
4) Select the option that gives you transistor parameters
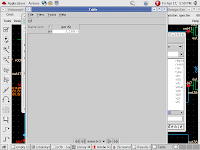
4) Right click on gm. Select table and you will obtain the gm of the desired mosfet :)
Friday, April 17, 2009
Design of a 2 stage op amp
DESIGN CONSTRAINTS:
1)SR = 10 V/usec
2)Av = 5000 V/V
3)GB = 5 MHz
4)CL = 100 fF
5)Pdiss < 0.3 mWatt
6)ICMR+ = 1.5 Volt
7)ICMR- = 0.2 Volt
Design consideration:
We consider that
1)10uA current flows through 1st stage
2)20uA current flows through the next stage
3)A cascoded current mirror it used for realizing the current source( vary its W/L to get 20uA and 10uA currents resp).
TECHNOLOGY USED: 180nm technology corresponding AC analysis gives:
This is the Mag-Phase plot for (0-10^12)Hz frequency range.
Problems Encountered:
1) Regarding phase plot:
Between (10^8- 10^9),in the magnitude curve, we have a - 40dB slope(due to presence of poles) .There after we have a zero. So theoretically there should be a positive slope for the phase plot (due to the presence of zero), though no such thing can be observed from the simulation result.
2) Regarding frequency compensation:
Variation in R and Cc is not giving much difference in the frequency response (phase margin).
Monday, April 6, 2009
UTube Ripper in Ubuntu
1) Download .deb package from here
2)After downloading Double click the file to start installation. This will fetch and install all its dependencies.
3)Go to Applications—>Internet—>Utube-ripper
Sunday, April 5, 2009
MUST SEE links on Electronics
1)Lectures by Jacob Baker
2)Videos on CMOS
3)MIT video lectures on circuits and electronics
4)MIT Course material on analysis and design of Digtal ICs
5)MIT Course material on Microelecronics devices and circuits-I
6)MIT Course material on Microelecronics devices and circuits-II 7)Principles of digital communication - I(video)
8)Principles of digital communication - II(video)
9)High speed communication circuits
Subscribe to:
Posts (Atom)